페이지 정보
본문
Seeing the Bigger Picture: Korea’s Climate Change Situation Map
Recorded by Hyerin Shin
2025-10-23
Script
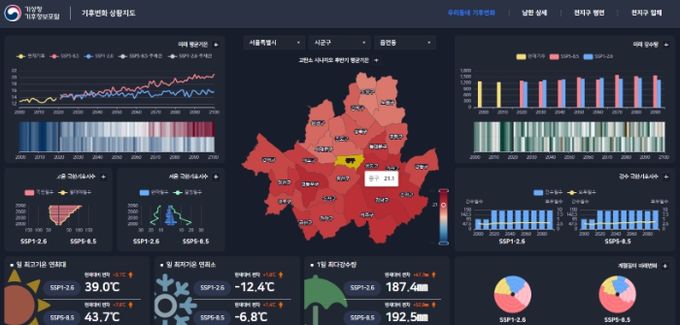
Have you noticed how the weather’s been all over the place lately? One day it feels like summer, and the next day you’re reaching for your coat. Sometimes it rains nonstop for days, and other times it’s completely dry for weeks. And even though we all check the forecast, it still feels like the weather changes faster than we can keep up. If you’ve ever been caught without an umbrella, or turned on the heater right after wearing short sleeves, you’re definitely not alone. But here’s something you might not know: there’s a service in Korea that helps you actually understand these unpredictable patterns—not just today’s forecast, but the long-term changes happening in our climate. It’s called the Climate Change Situation Map, and it’s provided by the Korea Meteorological Administration’s Climate Information Portal. This is an official, data-based online platform that visualizes how Korea’s climate has been changing over time. It doesn’t just tell you what the temperature is today—it shows how temperatures, rainfall, and other climate indicators have shifted over the past decades, and even how they’re projected to change in the future. You can explore maps that show regional trends, like how average summer temperatures are rising, or how heavy rain events are becoming more frequent in certain areas. For example, you can see how Seoul’s annual average temperature has gone up steadily since the 1970s, or how southern coastal regions are expected to experience more intense rainfall in the coming decades. Each map is based on scientific climate models and long-term observations, so it’s not just a guess—it’s grounded in real data collected by Korea’s national meteorological network. Now, the website itself is in Korean, but that doesn’t mean it’s out of reach for international users. If you turn on the Google Translate feature in your browser—something that most browsers support—you can instantly view the entire site in English. It works surprisingly well, and the visuals and charts make it easy to understand even if the translation isn’t perfect. Whether you’re a student studying in korea, a traveler curious about the weather, or simply someone who wants to understand how global climate change is affecting Korea, this site gives you a clear and accessible way to explore the data. It helps connect the dots between those sudden cold snaps, heavy rains, and longer summers we’ve all been feeling lately. So the next time the weather catches you off guard, remember—it’s not just bad luck or inaccurate forecasts. It’s part of a larger story about how our climate is evolving. Visit the Climate Change Situation Map at climate.go.kr, and take a few minutes to see how Korea’s climate is changing over time. It’s an eye-opening way to understand what’s really happening beyond the daily forecast—and to prepare a little better for the world we’re living in.
첨부파일
-
251023_podcast.mp3 (4.5M)
0회 다운로드 | DATE : 2025-10-23 15:46:00